

The non-ionizing energy loss is obtained from the integral (see the corresponding webpage, see also references therein):
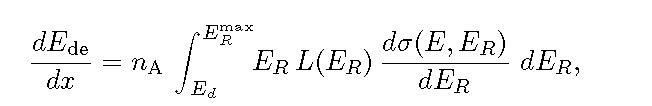
where ER is the recoil energy, L(ER) is the Lindhard partition function, and dσ is the differential nuclear scattering cross section. Since the integrand depends on ER, the NIEL integral gives relevant weight to the high energy tail of recoil-energy spectrum. Furthermore, in an elastic proton–silicon scattering the recoil energy transferred to a target nucleus (see Eq. (1.108) at page 37 of [Leroy and Rancoita (2012)]) is related to the scattering angle, q', in the center-of-mass system by
![]()
where ER,max is the maximum recoil energy allowed by two-body kinematics. Large recoil energies therefore correspond to large scattering angles, implying large momentum transfer between projectile and target atom.
In SR-NIEL treatment the differential scattering cross section is integrated analytically over the full recoil energy range, ensuring that the contribution of these rare large-angle events is fully included in the NIEL calculation. By contrast, Monte Carlo simulations rely on discrete sampling of interaction kinematics. Even with 107 simulated primaries, the number of events producing very large recoil energies remains quite limited. Thus, statistical fluctuations may lead to an under estimation of the high energy contribution of the spectrum and, as a consequence, to a non-negligible under estimation of the deposited NIEL value (e.g., see Table 1).
Proton Case
The deposited energy spectrum induced by 1 GeV protons traversing 100 µm of silicon is shown in Fig. 1. The Geant4 Monte Carlo simulation (blue histogram) was performed with 2×10⁷ primary particles and is compared with the SR-NIEL prediction (red curve). The vertical dashed line indicates the silicon displacement threshold energy, Ed=21 eV, which defines the lower limit of recoil energies contributing to non-ionizing energy loss (NIEL).
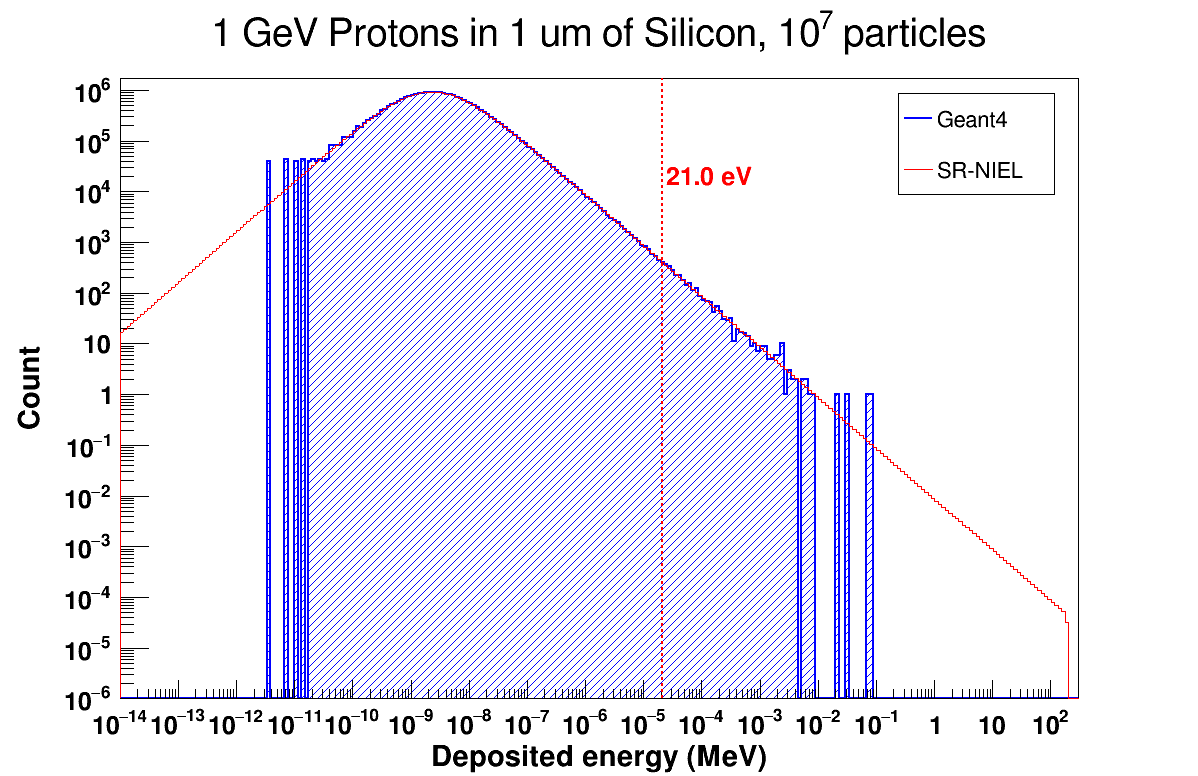
The agreement between Geant4 and SR-NIEL is quite satisfactory over most of energy range. For istance, around the distribution peak (10-9 - 10-7 MeV) and the subsequent decrease of energy spectrum over several decades, the spectrum is accurately reproduced. However, deviations become visible in the high-energy region. Above approximately 10-1 MeV the Monte Carlo distribution exhibits increasing statistical fluctuations and a steeper drop compared to the smooth SR-NIEL curve. Since the NIEL quantity is obtained by integrating the recoil spectrum above the displacement threshold, such an underpopulation of the high-energy tail leads to a systematic underestimation of the total NIEL value obtained from Geant4 simulation. In addition, this underpopulation is particularly relevant because the high-energy part of recoil spectrum provides a relevant contribution to NIEL integral. As a consequence, relatively rare high-energy recoils can result in a discrepancy between the NIEL obtained from a Geant4 simulation and that one expected (predicted) from SR-NIEL treatment.
A comparison with the lower-energy case shown in Fig. 2 further clarifies this behavior. Figure 2 reports the deposited energy spectrum for 1 MeV protons traversing 1 µm of silicon, simulated with 107 primary particles. In this regime the Geant4 histogram and the SR-NIEL prediction overlap almost perfectly over the entire deposited energy interval, from the lowest simulated energies up to the highest recoil energies produced in the interaction. In particular, no deficit is actually observed in the high-energy region of energy distribution.
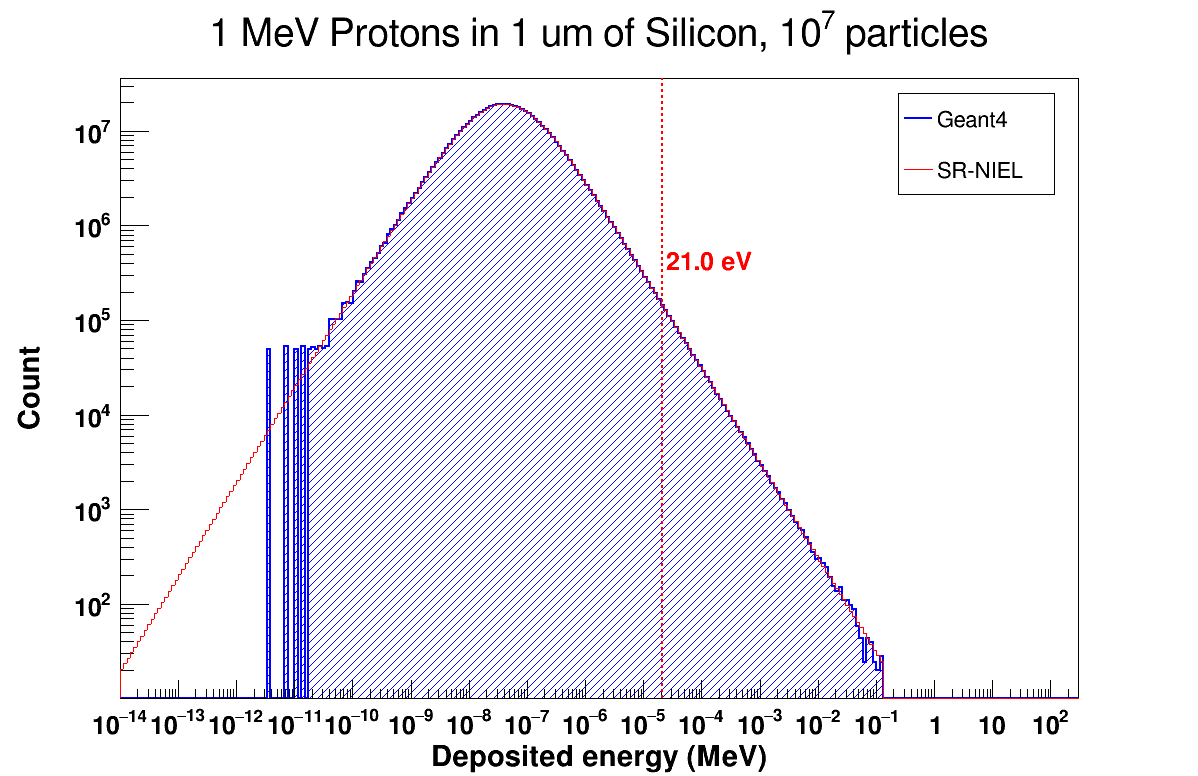
The different behaviour is explained by the scattering kinematics at lower projectile energies. In fact, for 1 MeV protons relatively large energy transfers relatively occur with higher probability. Consequently, Geant4 reproduces the SR-NIEL prediction across the full recoil energy range.
The two cases above discussed demonstrate that the discrepancy observed at 1 GeV is mainly due to statistical sampling limitations associated with extremely rare large-angle scattering events. Therefore, at high energies the Geant4 simulations are expectected to be increasingly sensitive to very small probability events.
Electron Case
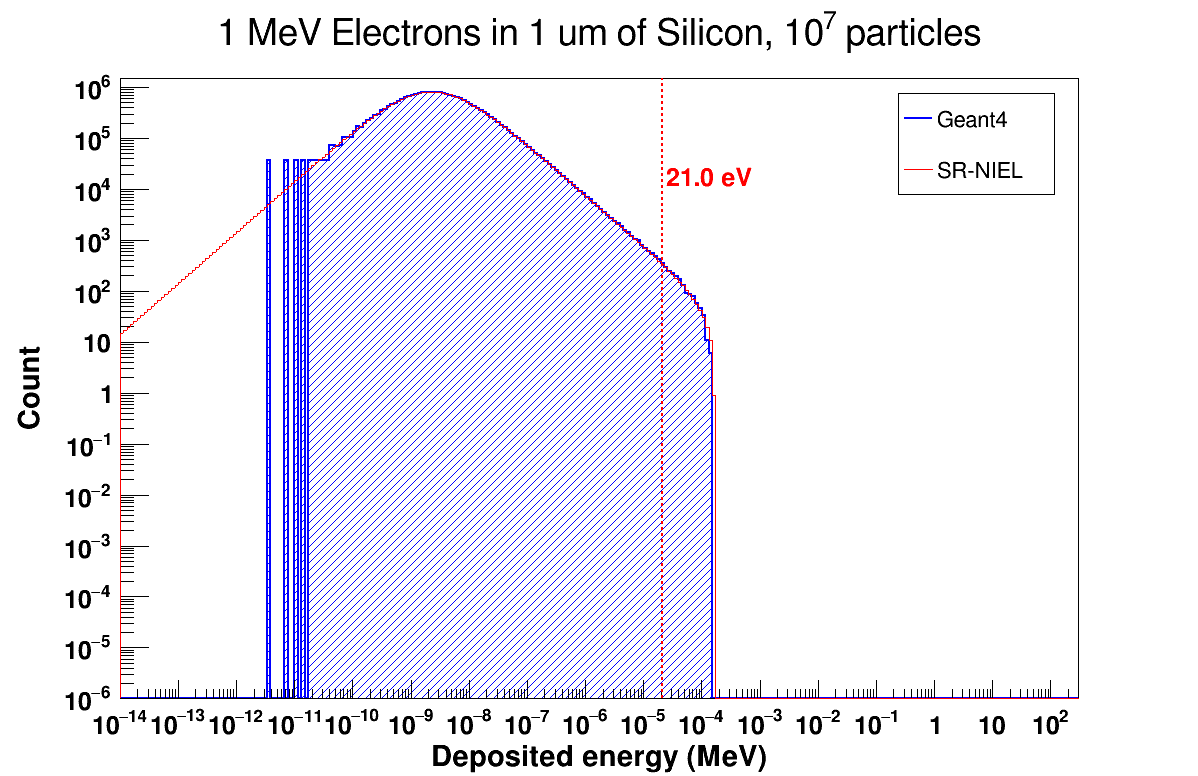
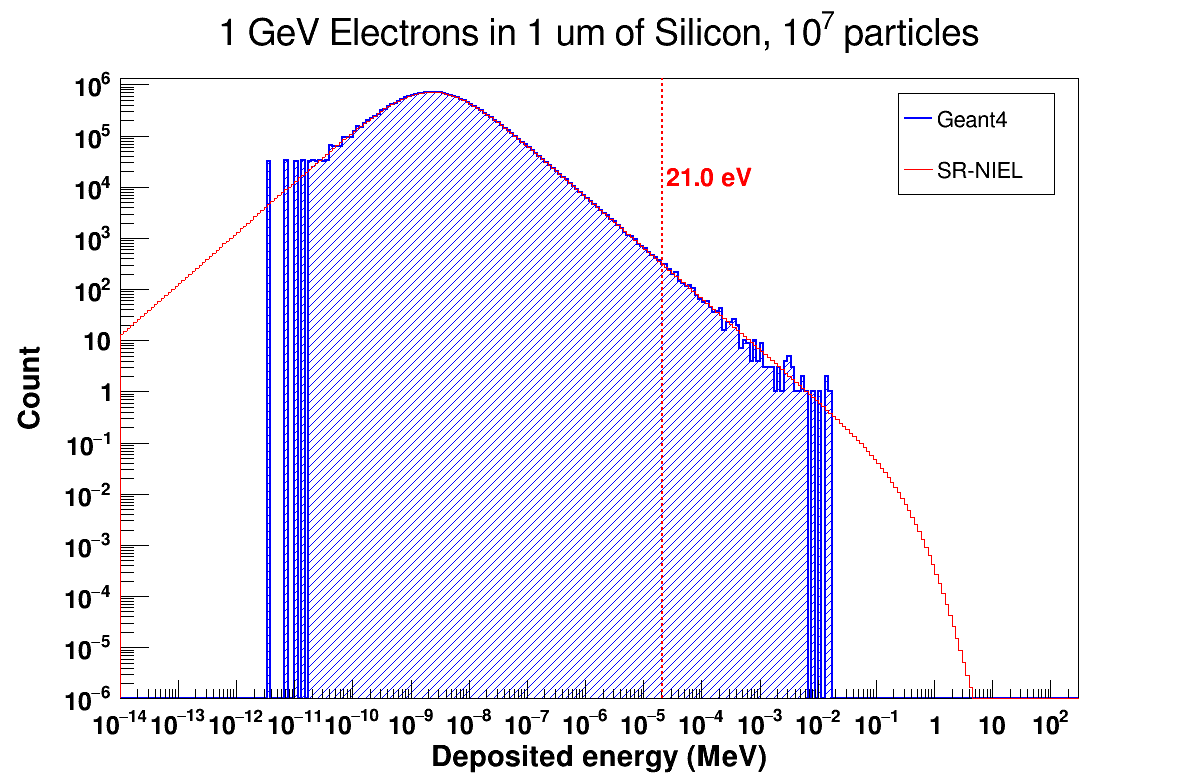
A similar comparison can be performed for incoming electrons. In Figs. 3 and 4, deposited energy spectra produced by 1 MeV and 1 GeV electrons traversing 1 µm of silicon are shown. In both cases the spectra obtained with the Geant4 Monte Carlo simulation (blue histograms) are compared with the SR-NIEL predictions (red curves) using 107 primary particles.
For the 1 MeV electron case (Fig. 3) the agreement between Geant4 and SR-NIEL is quite satisfactory around the distribution peak 10-9 - 10-8 MeV and the the subsequent decrease of energy spectrum. The cutoff around ER,max at approximately 10-4 MeV is also correctly reproduced. As a consequence, the Monte Carlo simulation above the displacement threshold energy of 21 eV is expected to agree with the expected SR-NIEL predicted value (e.g., see Table 1).
A different behavior is observed for 1 GeV electrons (Fig. 4). In this case Geant4 reproduces the recoil spectrum around the distribution peak, but a clear deficit appears at high energies above 10-2 MeV. In fact, the SR-NIEL computed curve extends smoothly toward higher recoil energies, while the Monte Carlo histogram exhibits a rapid decrease and larger statistical fluctuations. This difference affects the NIEL value estimated by means of GEANT4 simulation (e.g., see Table 1).
Comparison of NIEL Values
The NIEL values obtained for protons and electrons at different energies are summarized in the table 1.
| Particle | Energy | SR-NIEL (MeV·cm²/g) | Geant4 (MeV·cm²/g) | Difference (%) |
|---|---|---|---|---|
| Proton | 1 MeV | 6.34E-4 | 6.37E-4 | +0.47% |
| Proton | 1 GeV | 1.99E-4 | 1.85E-4 | −7.04% |
| Electron | 1 MeV | 2.80E-5 | 2.84E-5 | +1.43% |
| Electron | 1 GeV | 1.34E-4 | 1.17E-4 | −12.69% |
In summary, the discrepancy of NIEL values obtained by means of GEANT4 simulations with the corresponding ones from the SR_NIEL model are mainly explained as resulting from statistical sampling limitations inherent to Monte Carlo simulations.